How to Track QR Code Performance: Analytics, UTM Tags, and User Behavior
You have created a QR code and placed it on packaging, a flyer, a storefront, a poster, or a social media post. At first glance, the job looks finished: someone scans the code and lands on your link. For a business, that is only the beginning. You need to know whether the QR code is actually working, how many people use it, when scans happen, which devices people use, and whether those visits turn into the action you wanted.
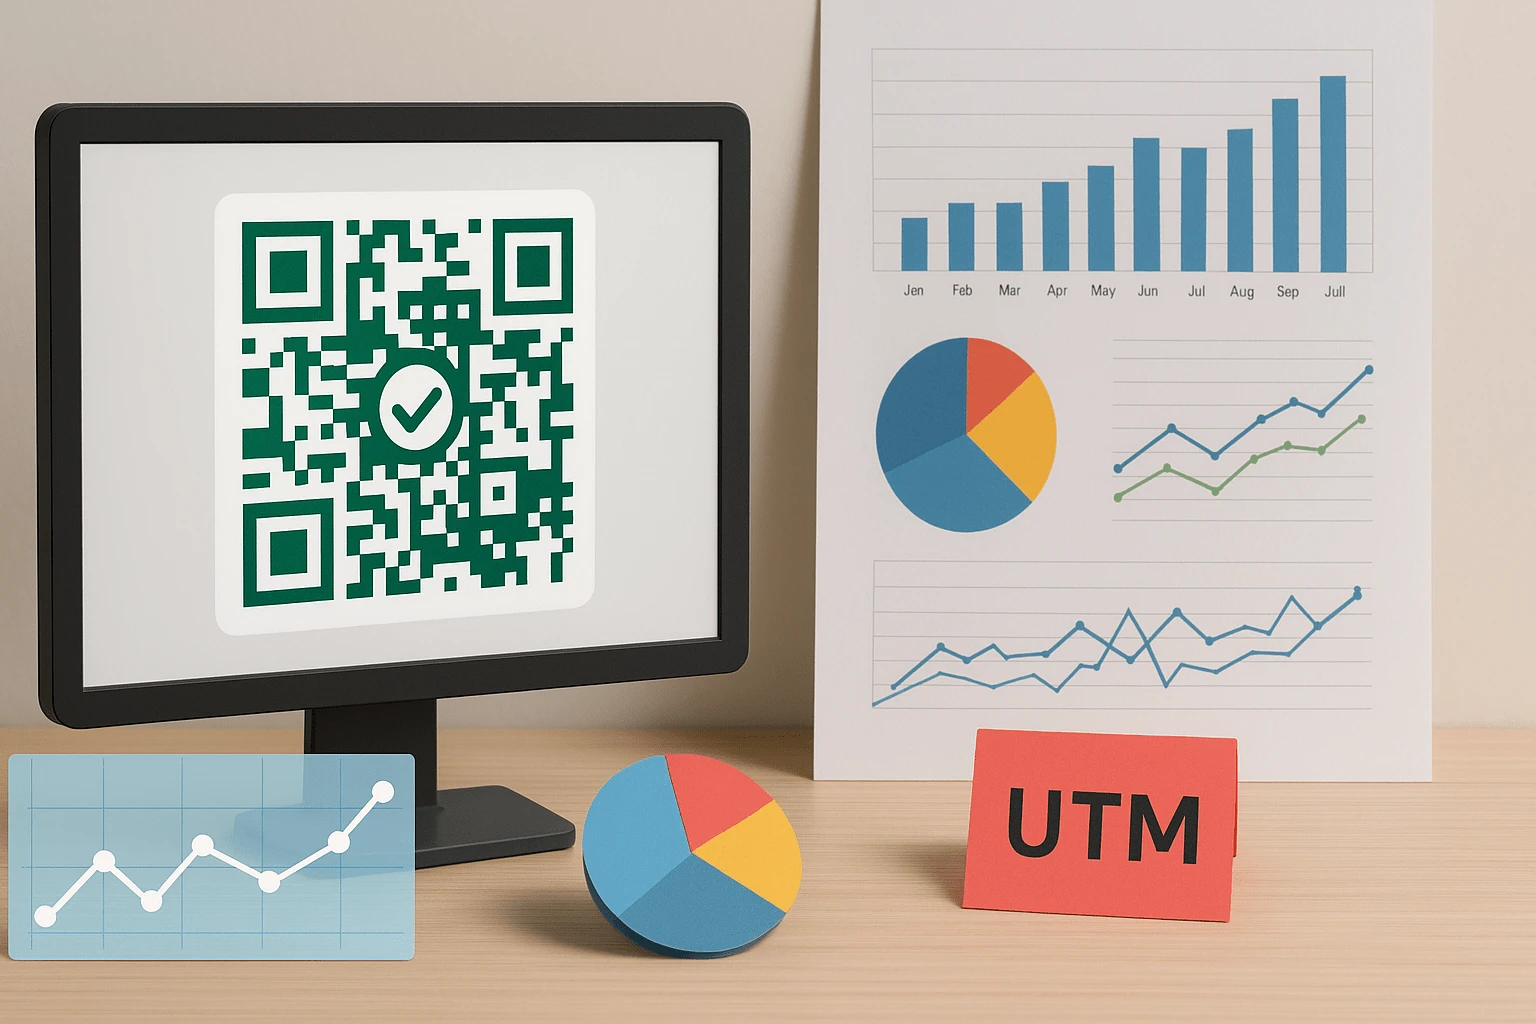
That is where QR code analytics becomes essential. It turns a simple graphic element into a measurable touchpoint between your brand and your audience. With scan statistics, UTM tags, device data, location insights, and activity timing, you can evaluate not only traffic volume but also traffic quality.
In this guide, we will explain how to track QR code performance in FbFast, which metrics deserve attention first, how to use UTM tags correctly, and how to read behavioral data without jumping to the wrong conclusions. The article is useful for marketers, founders, local business owners, event teams, and anyone using QR codes across offline or online communication.
Why Track QR Code Performance
Without analytics, a QR code is just an image that hides a link. You may know that materials were printed, placed, or handed to customers, but you do not know how people responded to them. It is like running a banner campaign without impression or click data: decisions are based on guesses instead of evidence.
FbFast lets you analyze QR codes in real time and see what happens after the code goes live. Scan volume reveals overall campaign interest, location data shows where people interact with the material, and device insights help you adapt the landing page to real viewing conditions.
For example, if most scans come from mobile devices, check page speed, form usability, and whether buttons display correctly. If a code gets heavy activity in one city but conversions stay low, the offer or message may not fit that local audience. If repeat scans are high, that can signal interest, a need to revisit the material, or people sharing the QR code with others.
This data is especially valuable for dynamic QR codes. Unlike static codes, they support scan tracking, destination URL updates after printing, and integration with external analytics systems through UTM tags. If you need more than a generated code and want to understand how it affects campaign results, use dynamic QR codes.
Tracking QR code performance helps you make practical decisions: change placements, test different messages, adjust budgets, identify the most active time windows, and compare individual campaigns. As a result, the QR code stops being a supporting design element and becomes part of a measurable marketing system.
What QR Code Analytics FbFast Provides
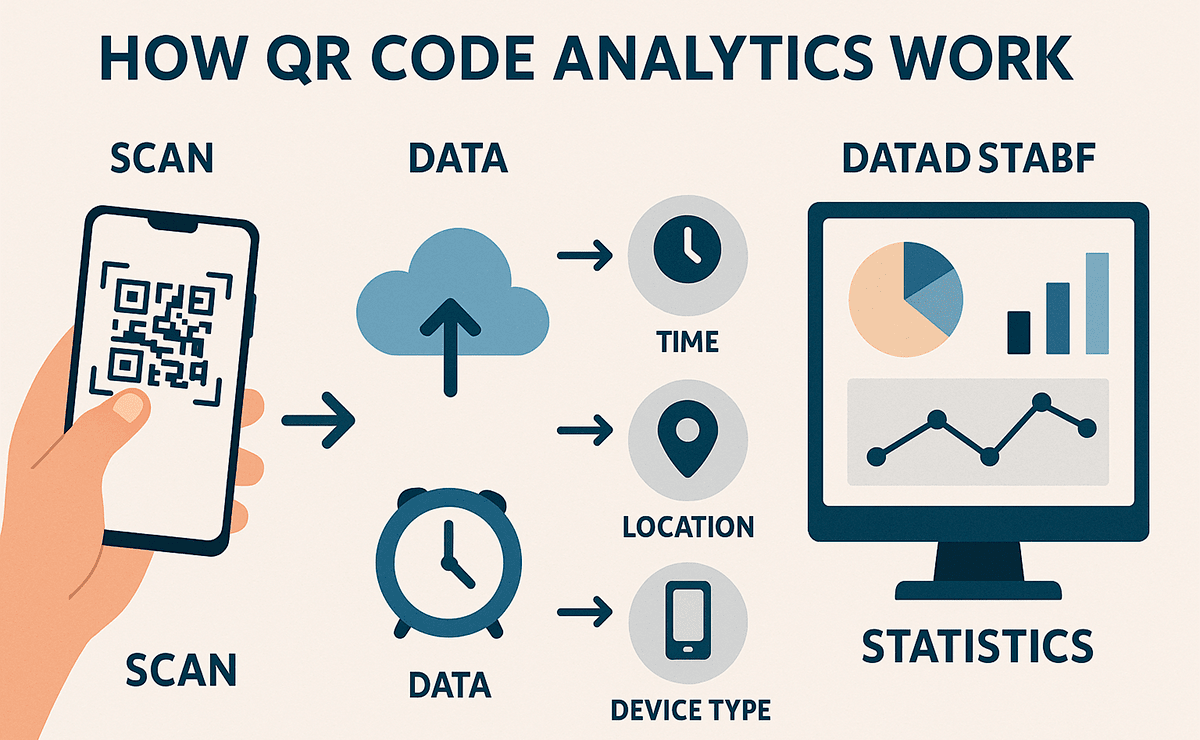
When you create a dynamic QR code in FbFast, you get access to expanded statistics. Data is collected in real time, helping you understand how people interact with your printed materials, packaging, outdoor ads, menus, presentations, or digital posts.
Analytics covers more than the total number of scans. It shows behavioral, technical, and geographic characteristics of your audience. That makes it possible to evaluate QR code performance across channels, devices, time of day, regions, browser language settings, and repeat interactions.
Core Metrics in FbFast Analytics
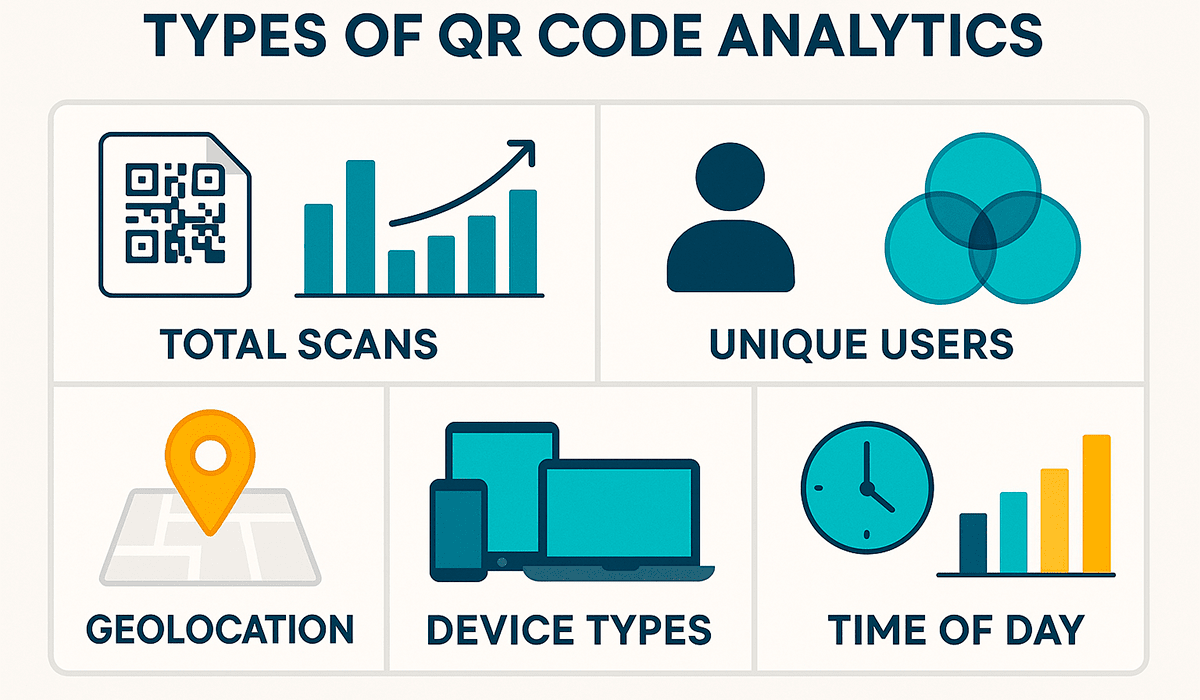
In FbFast reports, total scans show the overall level of interest in a code or campaign. Unique scans are shown separately so you can understand how many people interacted with the code for the first time. Repeat scans help you evaluate return visits, repeated access to an offer, or QR code sharing between people.
Location data shows the countries and cities where scans come from. For local businesses, this is especially important because you can quickly see whether the actual audience matches the intended region. If a campaign targets one neighborhood but scans appear heavily from other cities, it is worth checking how the code is spreading and whether unexpected traffic channels have appeared.
Device, operating system, browser, and browser language data help you prepare better post-scan content. For example, an audience using iOS and Safari may behave differently from Android and Chrome users. If a landing page, form, or file opens incorrectly on a specific device, analytics helps reveal where the problem may be happening.
Activity by hour and day adds another useful layer. This view helps identify peak scan periods and understand when your audience most often encounters the QR code. For a restaurant, that may be lunch hours; for an event, the registration window; for product packaging, the evening after purchase.
These metrics are presented in a practical format: charts, activity tables, diagrams, and a scan map. You can quickly assess the overall trend, then drill down into a specific code or campaign. If you need deeper analysis of the user path after the website visit, add UTM tags to the QR code and continue tracking in Google Analytics, a CRM, or another system.
Where to View QR Code Analytics in FbFast
Every dynamic QR code in FbFast has its own statistics page. After signing in, you see your list of created codes, choose the one you need, and open its analytics section. The main indicators are collected there, so you can evaluate results without complex third-party setup.
The interface is not designed only for analysts. If you manage marketing materials, run promotions, print menus, or place QR codes on products, you do not have to manually merge spreadsheets or configure technical integrations. Key data is available as soon as the code starts receiving scans.
In the dashboard, you can view the scan chart, compare total visits with unique users, evaluate activity by day and hour, see the scan map, and analyze devices, browsers, and audience language settings. This set of data gives enough context to understand whether a specific placement works and what changes are worth making.
Data is updated in real time. That is useful for short campaigns, events, seasonal offers, and tests. You can create a code in the morning, launch the materials during the day, and see first results by evening: how many scans occurred, when they happened, and which devices people used to open the link.
If you need to see the full user path from scan to purchase, registration, or form submission, combine FbFast analytics with UTM tags. In that setup, FbFast shows QR code interaction, while your web analytics or CRM records the next actions on the website.
QR code analytics in FbFast is part of the account dashboard. You do not need to install extra code on the landing page just to see basic scan statistics. Create a dynamic code, place it on the right material, and monitor results in the dashboard.
How to Use UTM Tags with QR Codes
A QR code can do more than send someone to a website. Add UTM tags to the link, and it becomes a measurable traffic source. This is especially important for offline placements, where it is hard to know which exact material brought a visitor without extra parameters.
UTM tags are URL parameters that pass source, medium, and campaign information to your analytics system. They let you compare QR code performance across packaging, posters, flyers, storefronts, catalogs, or social media banners. Without UTM tags, all visits can look the same. With them, you can see which placement brought the user.
How a Link with UTM Tags Works
Example link for a promotional campaign:
https://example.com/promo?utm_source=qr&utm_medium=poster&utm_campaign=spring_saleIn this example, utm_source=qr marks the traffic source, utm_medium=poster describes the placement, and utm_campaign=spring_sale identifies the campaign. When a user scans the QR code and opens this link, those parameters are passed to Google Analytics, your CRM, or another analytics platform.
As a result, you do not see an abstract visit. You see a specific source behind the action. That makes it possible to measure each QR code separately, compare placements, and make decisions based on data. For example, if the QR code on a flyer produces many scans but few leads, while the code on packaging produces fewer scans but more purchases, the next campaign should be optimized differently.
How to Create a QR Code with UTM Tags in FbFast
If you need a simple static QR code with UTM tags, you can create one for free without signing in on the website QR code page. Paste the finished URL with parameters, generate the code, and use it in a layout or publication.
A static code works well for simple use cases where the link will not need to change after creation and basic scan analytics is not required. But if you want to see statistics in FbFast, update the URL after printing, analyze devices, location data, repeat scans, and unique visits, you need a dynamic QR code.
Dynamic codes are created after signing in. They let you edit the destination link without reprinting, view scan statistics in real time, use additional access settings, and connect FbFast internal analytics with UTM data in your external systems.
If your goal is simply to send people to a stable page, a static QR code may be enough. If you need to analyze traffic, compare channels, calculate campaign ROI, and control the link after launch, choose a dynamic code with analytics access.

Combining UTM tags with FbFast QR code analytics gives you wider context. You can see when and where the code was scanned, then track what the user did after the visit: viewed a page, submitted a lead form, bought a product, or left without taking action.
Additional Dynamic QR Code Features for Marketing
A static QR code is enough for basic tasks, but real campaigns often need more flexibility. The link may change after printing, a promotion may run for a limited time, access to materials may be intended only for part of the audience, and scan volume sometimes needs to be controlled. In these situations, dynamic QR codes have a clear advantage.
In FbFast, after signing in to your account, you can control how and when your QR code works. This is useful for short-term promotions, test campaigns, seasonal offers, events, partner materials, and printed products that are difficult or expensive to reissue.
Change the Link After Printing
One of the most practical use cases is updating the URL after the QR code has already been printed. Imagine that flyers, labels, or posters are ready, but the campaign landing page changes. With a static QR code, that would mean printing again. With a dynamic code, you only update the destination link in your account, and all future scans point to the new address.
Schedule Access for Time-Limited Campaigns
A dynamic QR code can work only during a selected period. For example, during a trade show, presentation, sale, or event-only offer. You set the start and end dates, and the system manages access automatically. This reduces the risk of sending users to an expired promotion after it has ended.
Password Protection for Non-Public Content
Sometimes a QR code leads to materials that should not be available to everyone: dealer price lists, internal instructions, partner decks, private forms, or special terms for a selected audience. In those cases, access can be limited with a password. Users see the content only after entering the correct password.
Limit the Number of Scans
Scan limits are useful when an offer should be available only to a certain number of people. For example, a bonus for the first 100 participants, a limited promo code, or access to materials for a test group. Once the limit is reached, access closes automatically, and you keep control over campaign conditions.
Adapt by Geography and Language
A single QR code can lead to different content depending on the user's country, city, or browser language. For example, a visitor from Poland can see the Polish version of a page, while a user from Ukraine sees the Ukrainian version. For international campaigns, tourist locations, events, and multi-brand materials, this makes the interaction more precise.
These features matter not as separate tricks, but as answers to practical business scenarios. You can manage access, reduce reprint costs, test hypotheses faster, and measure results more accurately. At the same time, you do not need to add separate code to your website or connect complex third-party services for basic QR campaign control.
If you already use QR codes but do not analyze their performance or manage them after launch, the dynamic format can change how you run campaigns. After authorizing in FbFast, you can create a code, configure its behavior, and track results in the dashboard.
What QR Code Analytics Helps You Improve
Dashboard data is useful only when it changes decisions. In the QR code context, analytics helps you understand audience behavior, find weak points in a campaign, and gradually improve performance. Even a few basic metrics can explain why one placement works better than another, why scans do not become leads, or why activity appears at an unexpected time.
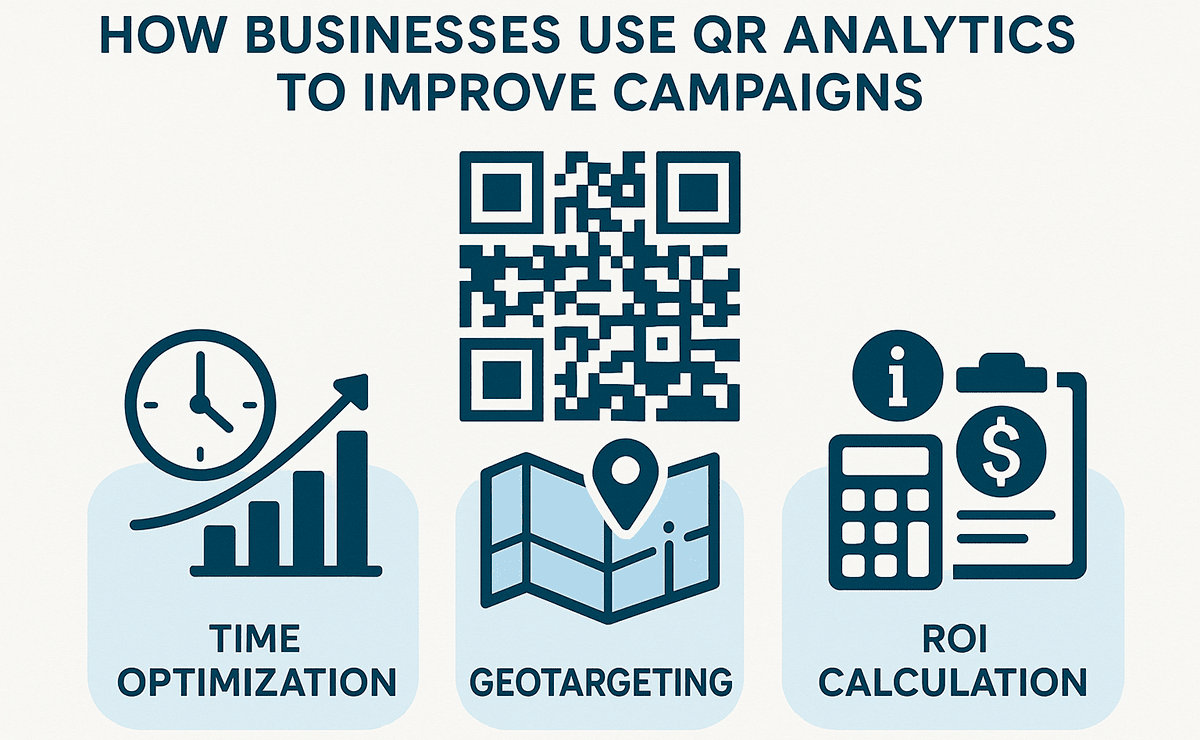
Optimize Display Timing
The scan chart helps identify peak activity hours. If most interactions happen between 6:00 PM and 10:00 PM, that is the period to plan extra communication: storefront updates, posts, newsletters, or reminders. For offline businesses, this can show when customers most often notice the material and have enough time to act.
Compare Placements and Channels
With UTM tags and separate dynamic QR codes, you can compare different placements side by side. For example, one code can be placed on packaging, another on a flyer, a third on a storefront, and a fourth in a catalog. If each one has a separate tag or a separate dynamic code, you can see which channel creates the most scans and which one drives target actions.
Do not look only at scan volume. A QR code on a product box may receive fewer visits than a code on a banner but generate more purchases or repeat visits. In that case, interaction quality matters more than traffic volume.
Segment the Audience
FbFast analytics lets you view breakdowns by device, location, and browser language. This helps you adapt the content people see after scanning. If most visitors come from mobile devices, the landing page should be as comfortable as possible on a smartphone. If scans come from several countries, consider language versions. If activity is concentrated in a specific city, create a local offer.
Segmentation does not have to mean complex personalization. Often, small changes are enough: adjust the wording, shorten the form, add local information, prepare a separate page for a region, or check whether the file opens correctly on the audience's most common devices.
Measure Campaign ROI
Combining scan statistics with UTM analytics helps identify which QR code led to a registration, purchase, lead, or another conversion. This lets you calculate profitability for individual placements rather than the campaign as a whole. The approach is especially useful when the budget is split between print, outdoor advertising, events, packaging, and digital channels.
When decisions are based on data, campaigns become easier to control. You can see which materials deserve scaling, which ones need changes, and which ones do not justify the spend. This reduces wasted budget and helps shape communication around real user behavior.
Behavioral Analytics: How to Read Report Numbers Correctly
In QR code analytics, collecting data is only half the work. Interpreting it correctly is just as important. A single number rarely gives the full answer. Scans should be read together with context: where the code is placed, what offer the user sees, which device they use, when they interact with the material, and what happens after the visit.
Many Repeat Scans Do Not Always Mean a Problem
Reports often show that total scans are much higher than the number of unique users. This does not necessarily indicate a technical issue. Repeat scans may mean that a person returns to the material, opens it on different devices, or forwards the QR code to someone else.
If the code is printed on packaging, repeat scans may show real contact with the product after purchase. If the code links to instructions, repeat visits may mean the user comes back while using the product. For menus, training materials, service instructions, or partner documents, repeated interaction is often a normal behavior pattern.
Device Type Helps Explain the Context of Interaction
Device data should not be treated as technical statistics only. It shows the conditions in which someone opens your content. If most scans come from smartphones, the post-scan page must be fast, clear, and adapted for a small screen. If you see a noticeable share of desktop visits, the QR code may be shared digitally or the link may be forwarded after the first scan.
Operating system and browser data can also point to friction. For example, a file may open differently in Safari and Chrome, or a form may be inconvenient on certain mobile devices. If you see many scans but few conversions, testing the page on the audience's most common devices should be one of the first steps.
Activity Hours Show the Best Moment for the Next Action
If the chart shows scan peaks in the morning or evening, it gives you a clue for communication planning. During these windows, the audience is already in contact with your material, so additional posts, email campaigns, SMS reminders, or advertising message updates may perform better.
Peak times vary by business type. A coffee shop may see the most scans in the morning, a restaurant during lunch or dinner, a conference before sessions begin, and product packaging after the workday. That is why your own data is more useful than generic benchmarks.
Geography Can Reveal Unexpected Code Distribution
A campaign may launch in one city while scans appear in other regions. There can be several reasons: users send photos of the code in messengers, products with QR codes move to other cities through logistics, tourists scan local materials, or partners share the code through their own channels.
This data should not be ignored. If the audience is wider than expected, you can adapt the page for several regions, clarify the offer, add language versions, or separate local campaigns with different QR codes and UTM tags.
Scan Count Is Not the Same as Effectiveness
One hundred scans with no leads can be a weaker result than twenty scans with several purchases. A scan is the first step, not the final goal. Effectiveness depends on where the QR code leads, how clear the offer is, how quickly the page loads, and how easily the user can take the intended action.
That is why QR analytics should be viewed together with UTM tags, conversions, and landing page quality. This approach gives you more than statistics. It shows the full interaction path: a person saw the code, scanned it, opened the page, evaluated the offer, and either took action or left without a result.
When QR Code Analytics Is Not Required
Despite the advantages of dynamic QR codes, there are cases where a static code is enough. Not every QR code needs to be part of a complex analytics system. Sometimes the main job is to provide quick access to information, not to track user behavior.
A QR Code for Wi-Fi or Simple Access
If a code is used to connect to Wi-Fi in an office, cafe, hotel, or event, analytics is often not critical. The purpose of this type of code is to simplify network access. If the connection details do not change, a static QR code works reliably and needs no extra setup.
One-Off Informational Materials
Installation instructions, a PDF presentation, technical documentation, or a reference file on packaging may not need analytics if the link is permanent and the destination page is not expected to change. In that situation, a static code is simpler, faster to create, and sufficient for the task.
Business Cards and Personal Contacts
For a vCard or a contact QR code, the main value is saving details to an address book quickly. Analytics is not always practical here, especially if the code is used on a personal business card, badge, or small print run. The static format works directly and does not depend on an external service.
Internal Labeling Without a Need for Marketing Analysis
If QR codes are used in logistics, equipment labels, inventory, or internal documents, analytics may be secondary. In a closed environment, direct access to the right information is often more important: a product card, instructions, a serial number, or an internal page.
In these cases, there is no reason to complicate the process. You can create a static QR code and use it without additional settings. But if you later need to change the link, restrict access, or see scan statistics, it is worth moving to a dynamic format.
Conclusion
In marketing, QR codes are more than a convenient bridge from offline to online. With the right setup, they become a measurable audience interaction channel. Dynamic codes with FbFast analytics help you see scans, unique and repeat visits, location data, devices, activity time, and other metrics needed for decision-making.
If you work with offline advertising, packaging, menus, events, leaflets, catalogs, or partner materials, scan data helps you understand what actually attracts audience attention. UTM tags complete the picture by showing which QR codes lead not only to visits but also to real actions: leads, purchases, registrations, or return visits.
Start with a simple scenario: create a dynamic QR code, add UTM tags to the destination link, place the code on one or several materials, and compare results in the dashboard. The first data will show which channels perform better, where the message should change, and how the audience behaves after scanning.
To test this in your own campaign, sign in to your account or create a new one in FbFast. A dynamic QR code gives you not only a link for the visit, but also the data needed to manage the result.