QR Codes with Analytics: How to Connect Scans with CRM, Google Analytics 4, and UTM
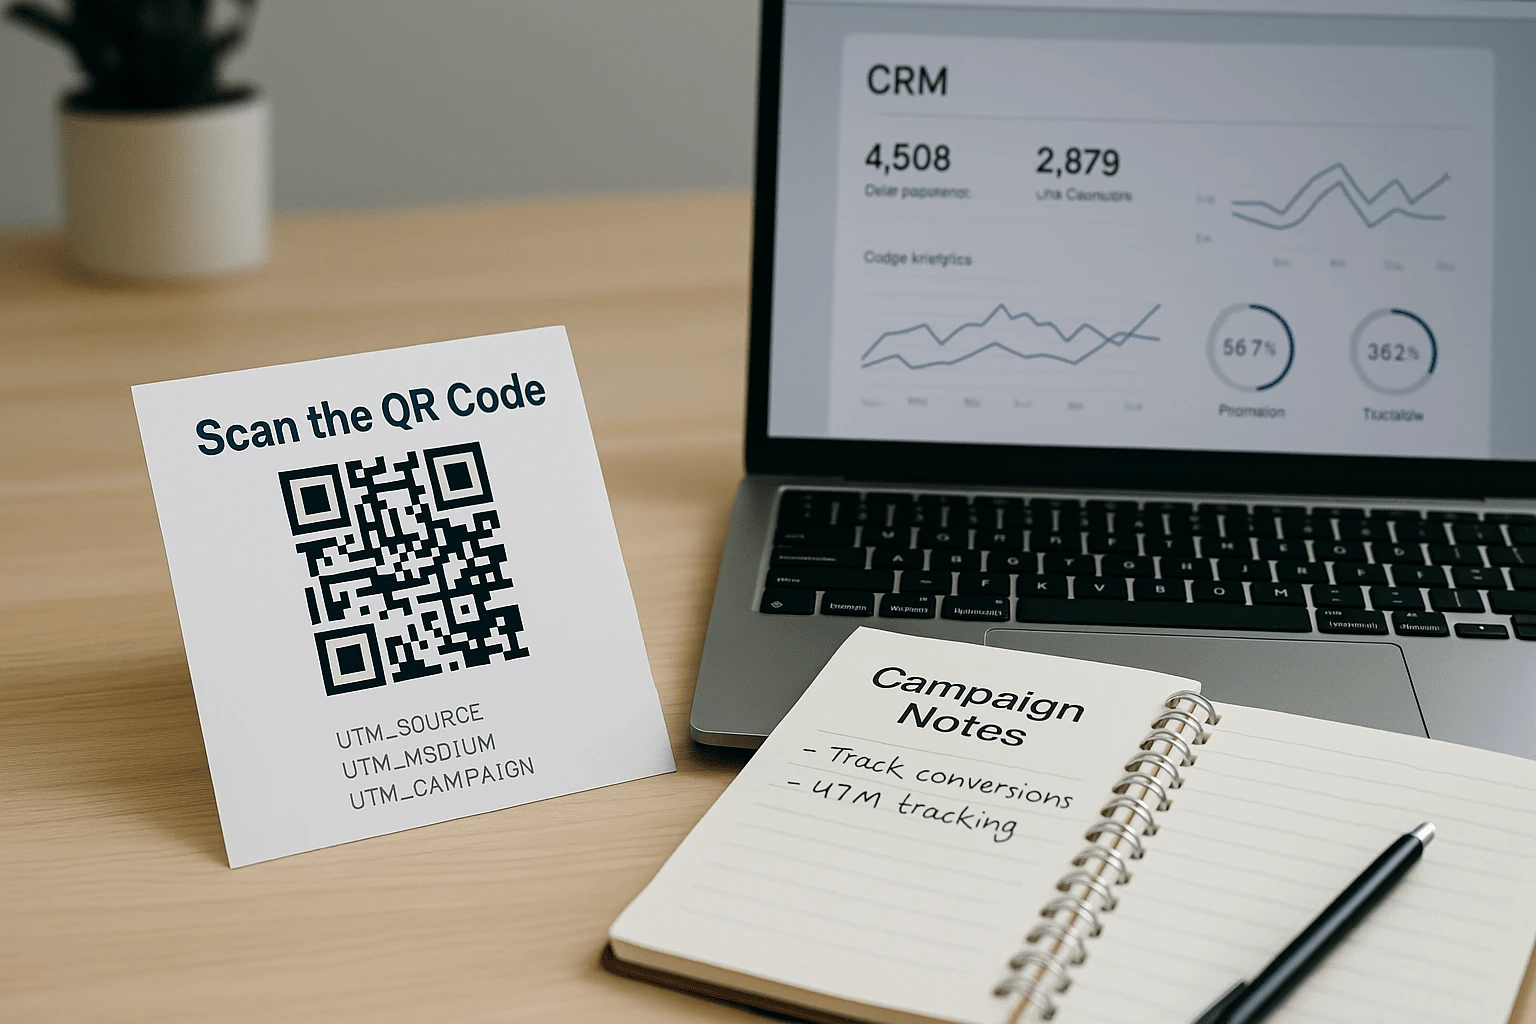
A business invests in flyers, posters, billboards, packaging, POS materials, or event booths. Every touchpoint carries a QR code: it opens a website, form, video, promo page, or bonus offer. The campaign looks well planned, people scan the code, and website traffic goes up. Then the activity ends, and the team faces the real question: which placement actually moved the needle?
If the QR code is just a plain link without analytics, the answer will be vague. Some visits will land in reports as direct traffic, some will blend into other channels, and leads in the CRM may arrive without a source. Marketing sees activity, but not the poster, city, store, booth, or message format that actually brought the user in.
That is why a QR code should be treated as more than a convenient bridge from offline to online. With the right setup, it becomes a measurable entry point: it passes UTM tags, appears in Google Analytics 4, preserves the lead source in CRM, and helps compare the performance of offline channels.
This article explains how to turn every QR code scan into a clear analytics event, lead, or sale. The focus is not on building a complex technical system, but on the setup logic: how to structure URLs, where to read the data in GA4, how to send UTM values into CRM, when a dynamic QR code is worth using, and which mistakes to catch before anything goes to print.
The guide is useful for teams just starting with QR analytics, as well as teams already using Google Analytics or a CRM that want to connect offline communication with real user actions more accurately.
How QR Code Tracking Works and Why UTM Tags Protect Your Data
A QR code does not collect full marketing analytics on its own. Its basic job is simple: encode a link that opens after a scan. If that link is a standard URL with no extra parameters, analytics tools may not understand where the visitor came from. For Google Analytics, that session can look like a direct visit even though the person may have scanned a poster, package, promo stand, or receipt.
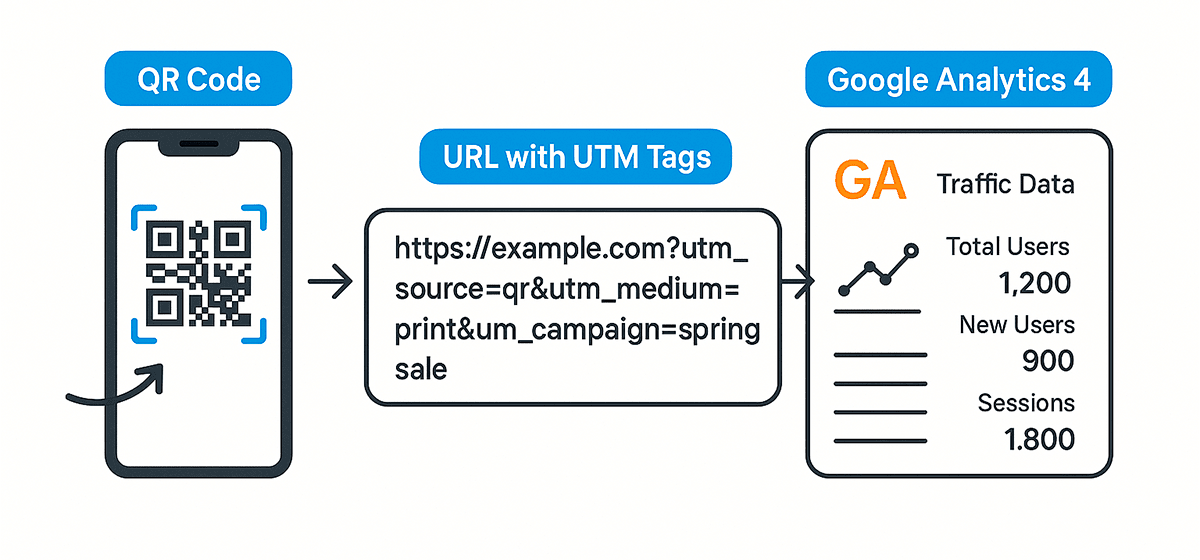
UTM tags add the missing context. These are parameters at the end of a URL that tell analytics systems the source, medium, campaign, and exact placement variation. For example, a poster QR link might look like this:
https://yourbrand.com/promo?utm_source=qr&utm_medium=poster&utm_campaign=spring_offer In this structure, utm_source identifies the traffic source, such as QR. utm_medium clarifies the carrier or format: poster, packaging, receipt, billboard, or another medium. utm_campaign groups visits under one marketing campaign, so reports can show the total impact of that activity.
For more granular analysis, add utm_content. This parameter helps distinguish one poster from another, compare cities, stores, booths, creative layouts, or placement zones. For example: utm_content=location_a
utm_content often becomes the key to practical decisions. If the campaign runs across several retail locations, one shared QR code only shows the aggregate result. Separate codes, or at least separate UTM values, show where the advertising performs well and where budget is being spent with little visible effect.
Technically, adding UTM tags is easy. The hard part is naming discipline. The same channel should not appear as QR, qr, qr-code, and QrCode, because analytics will treat them as separate sources. Agree on one format in advance: lowercase, Latin characters, no spaces, and consistent hyphens or underscores. It feels minor while links are being created, but in reports it decides whether the data stays clean.
Integrating QR Codes with Google Analytics 4: What You Can See in Reports
Once UTM tags are added, QR traffic stops being anonymous. Google Analytics 4 sees not just a page view, but a session with context: where the user came from, which medium carried the scan, which campaign it belonged to, and which placement variant triggered it. This lets you compare QR codes the same way you compare email campaigns, social ads, or paid search.
In GA4, these visits can be reviewed in Acquisition > Traffic acquisition, and in event reports if the right conversions are configured on the site. At a basic level, sessions, source, medium, and campaign are enough to understand channel performance. For deeper analysis, track what happens next: page views, button clicks, form submissions, video views, add-to-cart events, or purchases.
If the URL structure is correct, reports can show total visits from QR codes, distribution by media such as utm_medium=poster or utm_medium=packaging, campaign performance, post-scan behavior, and conversions. The most valuable number is not the scan count itself, but the connection between the scan and the next action: did the person submit a request, read the instructions, or move toward a purchase?
GA4 is built around events. That means almost any meaningful action after the visit can be recorded as an event: page_view, session_start, form_submit, purchase, video_start, or another event you configure through the website or Google Tag Manager. This is how you build a path from a QR scan to a business outcome.
Forms deserve special attention. If the QR code opens a lead form, the form_submit event should keep or pass the required UTM parameters. Otherwise, you will have a conversion, but not a reliable source. The report will show that a lead was created, but not whether it came from a billboard, package, event, or printed brochure.
A common situation: the team knows QR codes were used, but analytics shows the visits as direct. The issue is usually not the QR code, but the link inside it. UTM tags may be missing, misspelled, pasted with spaces, written in non-Latin characters, or stripped during a redirect. Before printing, test the whole path: scan, page load, GA4 session capture, and UTM visibility in reports.
Practical check: if a QR code leads to a form, test not only the page opening, but also the source data after the form is submitted. This is where the link between scan and lead is most often lost.
How to Connect a QR Code with CRM and Why It Matters
If a user leaves contact details after scanning, QR analytics should not stop at Google Analytics. The lead source needs to reach the CRM, so sales and marketing can see not only a name, phone number, or email, but also the context behind the lead. That context shows which offline materials generate qualified enquiries.
A simple example makes it clear. A customer scans a QR code on product packaging, opens a bonus page, and leaves their contact details. The form sends UTM parameters into the CRM: utm_source=qr, utm_medium=packaging, utm_campaign=loyalty_bonus, utm_content=product_line_a. The lead card no longer says only "website request". It contains a traceable chain: QR code, packaging, campaign, and product line.
For sales, this gives better context before the first conversation. For marketing, it creates reporting by source, comparison between offline touchpoints, visibility into lead quality, and a way to connect campaigns with revenue. If the CRM supports automation, the lead source can trigger different flows: a dedicated email sequence for packaging scans, a sales task after an exhibition scan, or a special offer for users coming from a receipt.
In most modern CRMs, including Bitrix24, HubSpot, Pipedrive, and Zoho, the main requirement is that the website form has fields for UTM tags. These fields can be hidden from the user and filled automatically from the URL. After submission, the values are sent to the CRM through a standard integration, API, webhook, or another available mechanism.
If you use custom forms, check whether they collect utm_source, utm_medium, utm_campaign, and utm_content. The last parameter is often underrated, even though it distinguishes a poster near the entrance from a poster inside the store, one location from another, or an event booth from handout materials.
It is also important not to stop at "the data is being sent". After launch, inspect several real CRM leads and confirm that the source is saved correctly, fields are not truncating values, and reports are not merging different campaigns into one. Otherwise, the integration may work technically while producing much less management value than expected.
When QR and CRM Integration Is Actually Needed
CRM integration is not necessary in every QR scenario. It is worth adding when a scan creates contact with a potential customer, or when the business needs source history for future sales, support, or follow-up communication. If a QR code only opens a public instruction page with no form, scan analytics and GA4 data may be enough.
Use CRM when the QR code captures leads or starts a sale
Integration makes sense when you collect an email, phone number, name, consultation request, event registration, or other contact data. In that case, the lead source should be saved together with the request. This shows which campaign generated the contact, which offline medium produced better enquiries, which locations perform best, and which scenarios deserve scaling.
CRM is also needed when a request starts a process: a sales call, email sequence, sales task, database segmentation, or personalized offer. In these scenarios, the QR code is not just a doorway to a page. It is the starting point of a funnel.
Skip CRM when the main action is content viewing
If a QR code opens a PDF, video, instruction page, menu, informational landing page, or other content without contact collection, CRM can be unnecessary. In that case, scan counts, devices, geography, UTM tags, and page behavior are often enough. This is especially true for temporary campaigns, test placements, and simple informational materials.
Still, even without CRM, keep the data structure clean. Today you may only analyze scans; tomorrow you may add a form or compare several placements. That is why UTM tags should be used from the beginning, even if CRM is not connected yet.
Hybrid approach: tracking without a full CRM
If CRM has not been implemented yet but you need to preserve traffic sources, simple forms with hidden fields or parameter capture can help. For example, a form can read UTM tags from the URL and save them together with the user response. This will not replace a full CRM, but it keeps the most important link intact: QR code, campaign, and specific request.
Our article on offline advertising covers scenarios where tracking works even without CRM, using dynamic QR codes with analytics.
Dynamic QR Codes: Analytics, Flexibility, and Control After Printing
One of the main problems with printed materials is that they are hard to change after launch. If flyers are already printed, stickers are applied, and the billboard is live, a wrong link or a new landing page can cost time and budget. Dynamic QR codes solve this because the code contains a short redirect link rather than the final destination.
When someone scans a dynamic QR code, the request first passes through a server and then redirects to the target page. This makes it possible to change the destination URL without reprinting materials, collect scan statistics, manage campaigns, and react quickly. For offline marketing, that matters because physical media often stay in circulation longer than the original promo period.
A dynamic QR code is useful when you need to update a landing page after printing, launch a seasonal offer, change the link for an event or short-term campaign, compare scans by device, language, or country, and track placement performance in a dashboard. We covered the basic metrics in more detail in our QR analytics guide.
In practice, a dynamic code gives several layers of control at once. You can change the page without touching the printed design, collect scan volume, compare activity over time, see geography and devices, and use UTM tags to connect the scan with Google Analytics and CRM. If a campaign runs for several weeks, this data helps you adjust while the campaign is active instead of waiting for the final report.
The full picture appears in dashboards, especially for dynamic codes, which we have already compared with static ones. You see not only the total number of visits, but also scan time, share of unique scans, device types, user language or country, and parameters that identify the source and channel. This turns the QR code from a simple link into a managed campaign asset.
If you want to connect QR codes more deeply with your marketing funnel, also read our article on QR codes in campaigns. It explains how to combine print advertising, landing pages, analytics, and the next user action into one funnel.
Useful note: analytics dashboards are available immediately after a dynamic QR code is created in FbFast. Scan data is gathered in one place, so basic analytics can be reviewed without extra integrations.
Use Cases: Where QR Codes with Analytics Work Best
QR codes with analytics work best when there is an offline touchpoint and a real need to understand what happens after that touchpoint. A person sees packaging, a receipt, poster, badge, booth, or leaflet, scans the code, and enters a digital flow. If the path is configured correctly, the business sees not only the scan, but also the follow-up action.
Below are common scenarios where a QR code, UTM tags, Google Analytics, and CRM provide the most value together.
Product packaging: instructions, bonuses, and feedback
A brand adds a QR code to a box for electronics, cosmetics, household goods, or food products. After scanning, the customer lands on a page with instructions, a video, warranty information, a bonus, or a feedback form. UTM tags record that the visit came from packaging, while additional parameters can identify the model, product series, batch, or sales channel.
If the page includes a form, the data can be passed into CRM. The brand then sees more than scan counts: it sees post-purchase reactions, such as who opened the instructions, left feedback, activated a bonus, or contacted support. More examples are available in our guide to QR codes on packaging.
Printed inserts: receipts, stickers, warranties, and package leaflets
A retail chain can place a QR code on a receipt, warranty card, sticker, or insert inside an order. For example, the QR code may open a loyalty program, purchase registration page, or repeat-order offer. If the URL uses utm_campaign=receipt and utm_content=store_42, GA4 and CRM can show which store generated the traffic.
This approach helps compare stores not only by sales, but also by customer follow-up behavior: registrations, repeat purchases, reviews, or loyalty program participation. We covered similar scenarios in our article on QR codes for retail and HoReCa.
Advertising campaigns: billboards, flyers, posters, and citylights
In outdoor advertising, a QR code helps measure what used to be estimated loosely. If the campaign runs in several cities, each city, or even each location, can use a separate QR code or a separate utm_content value. This shows where the campaign drives more visits, which spots perform better, and whether media formats differ in effectiveness.
Based on this data, teams can adjust budget, update creatives, move placements, or double down on locations that are already working. It is one of the most practical scenarios for offline advertising with QR codes.
Education: events, surveys, materials, and registrations
In education, QR codes are often used for event registration, access to learning materials, surveys, course payments, or quick links to schedules. If a university, school, or education project adds UTM tags, it can see which audience responds more actively: students, alumni, applicants, event visitors, or newsletter subscribers.
These segments can then support more precise communication: different messages, offer testing, or comparisons between events. In our article on QR codes in education, we also covered badge examples, registration forms, and post-event materials.
Healthcare: instructions, booking, and patient information
In healthcare scenarios, a QR code can lead to a video instruction, appointment page, medication information, patient checklist, or enquiry form. Analytics helps understand which materials are actually opened, when users scan the codes, which devices they use, and what they do next.
If the QR code opens clinic booking or a consultation form, the source should be passed into CRM or a medical information system. The request then gains context: not just "website form", but a specific channel, material, or campaign. More scenarios like this are described in our healthcare case study.
This logic can be adapted to almost any industry: cafes, conferences, service centers, manufacturers, education projects, or local businesses. The main point is not to stop at the QR code itself, but to decide in advance which data is needed after the scan.
Video and QR Codes: How to Track Views with Analytics
Not every QR code leads to a request or purchase. Often, after scanning, the user simply watches a video: an instruction, product overview, presentation, trailer, event recording, or training clip. At first glance, this scenario seems hard to measure, especially when the video is hosted on YouTube. In reality, analytics can be set up if the path is designed correctly.
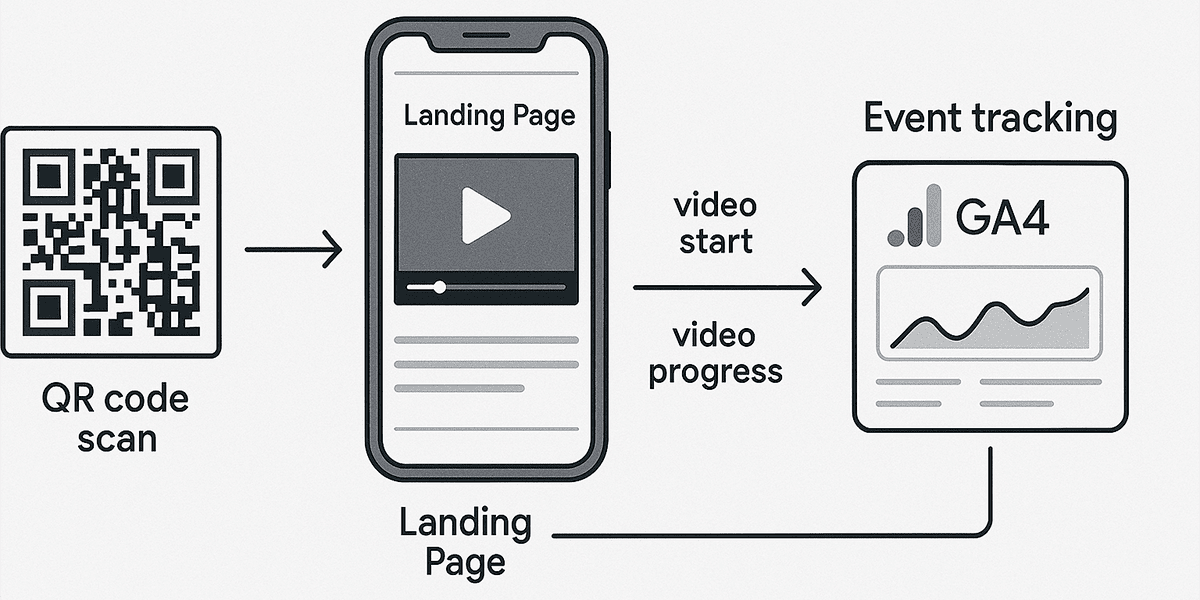
The most accurate option is not to send the user directly to YouTube, but to create an intermediate page on your website or another platform with analytics installed. The video sits on that page, and the URL keeps the UTM tags. GA4 then sees the QR session, and Google Tag Manager can additionally track video view events.
Option 1: video on an intermediate page with GA4
An intermediate page gives you more control. You can see the QR visit, measure video_start, video_progress, or CTA clicks, and build a simple funnel: QR scan, page open, video start, partial view, next action. This is especially useful for video instructions on packaging, training materials, event presentations, or videos used in outdoor advertising.
This approach also lets you add extra context next to the video: a short instruction, booking button, form, product link, or FAQ block. As a result, the video stops being isolated content and becomes part of a measurable journey.
Option 2: direct YouTube link with separate scan tracking
If an intermediate page is not possible, UTM tags can still be added to a direct YouTube link:
https://www.youtube.com/watch?v=dQw4w9WgXcQ&utm_source=qr&utm_medium=packaging&utm_campaign=howto_videoIn this case, YouTube will not pass those tags into your GA4 reports the way a page on your own site would. However, you can still analyze scans in the dynamic QR code dashboard, compare them with YouTube Studio views, and create separate videos or links for different placements. It is less precise, but still useful for understanding whether the QR code works as an entry point to video content.
So even content without a form, cart, or purchase button can become an analytics asset. The key is to decide in advance what you want to measure: scans, video starts, viewing depth, post-video clicks, or repeat engagement with the brand.
Our QR analytics guide includes instructions for configuring video events through Google Tag Manager for teams that want more detailed view tracking.
Common Mistakes When Connecting QR Codes with Analytics and CRM
QR analytics looks simple, but data is often lost in simple details. A broken UTM tag, one code reused across every placement, a static QR code for a campaign that may change, or a form that does not pass the source can damage reporting before the campaign gains momentum.
Missing or inconsistent UTM tags
If the QR code link points to a website without parameters, analytics will not receive the context it needs. You may see the session, but not know whether it came from a specific poster, package, or booth. Another frequent problem is inconsistent naming for the same source. In reports, qr, QR, and qr_code may appear as different entities.
To avoid this, create a simple UTM rules table for the team. It can define naming format, allowed source and medium values, campaign structure, and the logic for utm_content. This does not make the work heavier. It reduces manual mistakes.
Static QR codes for scenarios that may change
A static QR code is fine for a permanent link that will not need updates. But for an advertising campaign, seasonal offer, event, promo page, or long-lived printed material, it creates risk. If the URL changes, you either reprint the materials or accept an outdated destination.
A dynamic QR code lets you change the destination after printing while collecting scan statistics. For most marketing activities, it is better to plan for a dynamic format at the design stage.
One QR code for many placements
When the same QR code is used on a flyer, billboard, package, and booth, all data is mixed together. The report shows a total result, but not which medium created it. This is especially risky when the team wants to compare locations, formats, or cities.
Create separate QR codes or separate UTM values for every meaningful placement. At minimum, separate channels through utm_medium and specific variants through utm_content.
No clear reason to scan
A QR code by itself does not explain the value of the action. If there is no short prompt nearby, users may not understand why they should scan it. Copy such as "Get the guide", "Activate your bonus", "Register for the event", or "Check your warranty" increases scan intent because it removes uncertainty.
The promise next to the code must match the page after the scan. If the poster says "get a discount" and the user lands on a generic page with no obvious next step, part of the potential conversion is lost.
The post-scan page is not mobile-friendly
QR codes are almost always scanned from a smartphone. If the page opens poorly on mobile, loads slowly, has an awkward form, or hides the main action below the first screen, analytics may show scans while conversions stay low. That is not a QR code problem. It is a post-scan journey problem.
Before launch, test the path on several phones: from scan to page load, from form submission to CRM lead, and from CTA click to GA4 event capture. This takes little time and finds errors before materials go to print.
We have a separate guide to critical QR code creation mistakes with examples, cases, and launch-preparation tips.
Conclusion: A QR Code Is a Data Entry Point, Not Just a Link
From the outside, a QR code looks like a small square graphic on a poster, package, or receipt. For marketing, it can be a full data entry point. When you add UTM tags, connect Google Analytics 4, plan source transfer into CRM, and use dynamic codes for changing scenarios, offline communication stops being invisible to analytics.
QR analytics shows which materials work, which locations produce quality visits, which campaigns generate requests, and which ones need adjustment. It also lets teams optimize campaigns during the run, build a funnel from scan to sale, and make decisions based on data rather than assumptions.
The starting point does not require complex infrastructure. You need a correctly structured URL, consistent UTM rules, a quick check in GA4, and confirmation that the form passes the source into CRM. Tools such as FbFast simplify the process: a dynamic QR code can be created, tracked, and updated without reprinting materials.
If you are preparing a print campaign, updating packaging, planning an exhibition, launching offline advertising, or trying to understand the user journey after a scan, start with a properly configured QR code. It can be more than a convenient path to a website. It can be the beginning of precise answers: where the person came from, what caught their attention, and which action followed.
Create a dynamic QR code in FbFast, add UTM tags before launch, and verify analytics before printing. That way, you keep control of the campaign from the first scan.
See also: How to Track QR Code Effectiveness: Analytics, UTM, and User Behavior